If you're experiencing any display issues, please make sure you're using the newest version of your browser. The webpage was tested on Windows 10 with version 108 of Firefox, Chrome and Edge. On iOS, version 111 of Firefox and Chrome was used, as well as Safari 16.3 and Opera 97.0.
Also, if the page is unresponsive, please make sure you're not using a browser plug-in blocking the cookie consent banner.
Help
The predicted aligned error (PAE) is a metric for the confidence in relative positions of the predicted structure.
A high PAE at position (x, y) in the PAE matrix indicates a high expected position error for the residue at x, if the predicted and true structure are aligned at residue y. An extensive tutorial for the PAE can be found on the AlphaFold Protein Structure Database page bottom for any entry.
In contrast to the viewer of the AlphaFold Protein Structure Database, this PAE viewer allows to view the PAE of multimers, and integrates visualization of crosslink data, as well. The latter can be an important indicator for the reliability of the structure prediction.
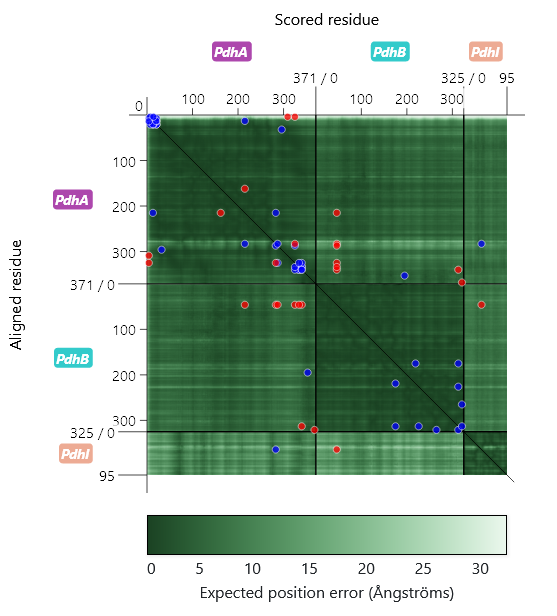
As can be seen on the left, the PAE matrix is divided up into several sections corresponding to the different subunits, whose labels can be found on the axes, as well. The axes ticks indicate the position of the residues within the subunits. The ticks at the end of the divider lines display the length of the subunit's amino acid sequence.
The circular markers correspond to cross-linked residues. They are colored to indicate violation (red) or satisfaction (blue) of crosslinker length restraints. In the case of the examples, a Cα-Cα distance ≥ 30 Å is considered a restraint violation. When a marker is clicked, the corresponding crosslink in the structure viewer is highlighted.
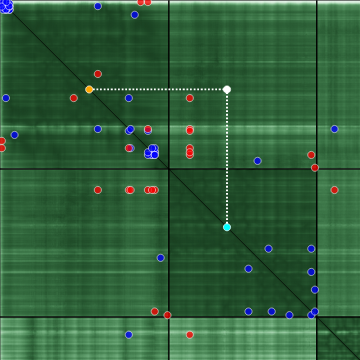
If some point of the PAE matrix is clicked, the position is marked and the corresponding x and y coordinates are projected onto the diagonal, which helps to interpret the relative distance of the residues within a sequence. The projected x coordinate is color-coded cyan, and y is color-coded orange. In the sequence viewer, the residue pair corresponding to that point is highlighted. For the structure viewer, the distance between the residues is also visualized.
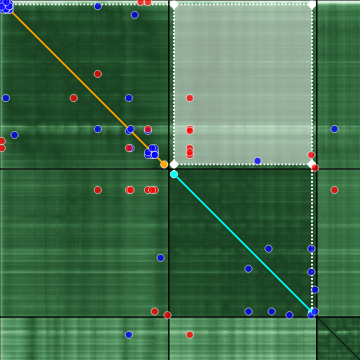
If a rectangle is selected by holding a click, the corresponding sequence ranges are projected onto the diagonal, using the same color code. Again, the corresponding residues are highlighted in the sequence viewer as well as the structure viewer.
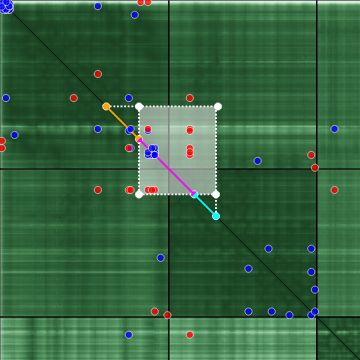
If the projected x and y ranges are overlapping, the overlap is color-coded magenta. A rectangular selection of this nature is hard to interpret in terms of the PAE of the relative position. For this reason, this special color code was introduced.
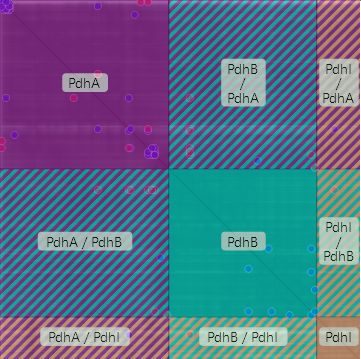
By holding the Shift key while the cursor is hovering over the PAE matrix, or by using the checkbox below the matrix, an overlay can be toggled, which shows rectangular sections of the matrix which correspond to the PAE of the complex subunits and of their positions relative to each other. If clicked, the corresponding residues are highlighted in structure viewer, using the color code of the subunits.
For all selections the corresponding (mean) PAE value is displayed numerically under the PAE graph. In case of crosslink selections, the mean value of the PAEs for both orientations (x/y and y/x) is displayed.
You can use the 'Upload' tab at the top of the page to upload complex structures, PAE values and crosslinks. It is also possible to label the different chains/subunits of the uploaded complex.
The form is designed to use the output files of AlphaFold-Multimer (use ColabFold or the Colab notebook from Deepmind for an online version). You can also download some sample files (GatB-GatA.zip) to try it out. Have a look at the included ReadMe for instructions.
If you would like to use the .pkl / .pickle files generated by AlphaFold directly, you can download the following Python script to convert them into compatible .json files: jsonify_scores.py
Usage: python3 jsonify_scores.py scores.pkl
scores.pkl is a placeholder for the .pkl / .pickle file containing the scores from AlphaFold. The script requires numpy to be installed. It was tested with Python 3.10 and the output of AlphaFold v2.3.1. Converting the output of older AlphaFold versions might require jax / jaxlib to be installed, as well.
Different structures and PAE files from following sources were tested:
- ColabFold v1.5.2: AlphaFold2 using MMseqs2 (2023-04-06) (older versions could not be tested, as the Colab notebooks seem to not be functional anymore)
- Colab notebook from Deepmind (2023-04-06)
- Output of local AlphaFold-Multimer v2.3.1 (pickle files converted using the provided jsonify_scores.py script)
- Downloads from the AlphaFold Protein Structure Database (2023-04-06) (however, structure downloads in .cif unfortunately cannot be read)
Structure file
Two structure formats for complex structures as well as monomers are supported: PDB (.pdb) and PDBx/mmCIF (.cif,.mcif,.mmcif). However, the structure downloads from the AlphaFold Protein Structure Database in PDBx/mmCIF format are unfortunately not supported. Please use the PDB format downloads instead.
Chain labels (optional)
The 'Chain labels' input field lets you define unique names for the chains/subunits of the predicted multimer. These labels will then be used for display in the viewers, instead of the chain identifiers which are read from the .pdb structure file, and which are usually single-letter identifiers. To provide the labels, type in a semicolon-separated list of unique, non-empty identifiers in order of the corresponding chains in the .pdb file. Example: GatB;GatA. If a label is invalid or the number of provided labels doesn't match the number of subunits/chains of the complex, the upload will fail.
Scores file
The PAE can be provided using the *_scores.json output of ColabFold, or the predicted_aligned_error.json by the Colab notebook from Deepmind (same as downloads from the AlphaFold Protein Structure Database). If you would like to use the output of an AlphaFold run directly, please use the conversion script jsonify_scores.py as described above. The JSON file should contain a JSON object (or a list with the object as its first element) with the following keys:
- pae / predicted_aligned_error
- An N*N number array (array of arrays), where N is the overall length of the complex amino acid sequence (total number of residues). pae[y][x] corresponds to the PAE at scored residue x for aligned residue y.
- max_pae / max_predicted_aligned_error (optional)
- A single number denoting the maximum PAE value. For AlphaFold-Multimer predictions, this value is usually clamped at 31.75. If not provided, the maximum PAE value from the PAE matrix is used.
- plddt (optional)
-
A number array of length N, where N is the overall
length of the complex amino acid sequence (total number of
residues).
plddt[x] corresponds to
the pLDDT?
of residue x. The pLDDT is a
per-residue estimate of [AlphaFold's] confidence on a scale from 0 - 100
(see FAQ on AlphaFold DB). These values will be used to calculate the mean pLDDT. - ptm (optional)
- A single number corresponding to the predicted TM-score (pTM)?, another model accuracy estimate.
- iptm (optional)
- A single number corresponding to the Interface pTM (ipTM)?, which scores interactions between residues of different chains.
Crosslinks file (optional)
CSV
A CSV file containing the crosslinks can be uploaded, as well.
A header row is required, which needs to define
the columns seen in this format example
(except for the optional RestraintSatisfied and
Atom* columns):
GatB,421,CA,GatB,457,CA,True
GatA,21,CA,GatA,56,CA,True
GatB,129,CA,GatA,22,CA,False
...
Other columns are ignored, and the order of columns
doesn't matter. The Protein1 and
Protein2 columns need to use the
user-defined labels, if provided; otherwise, the chain
identifiers from the structure file are used.
The positions in SeqPos1 and
SeqPos2 refer to residues and are 1-based, and can't be
higher than the number of residues in the corresponding complex
chains. The Atom1 and Atom2 columns are
optional, and refer to the names of the atoms in the corresponding
residues. If not provided, 'CA' (C⍺ atom) is used by
default.
The RestraintSatisfied column is optional and
can be used to distinguish the corresponding crosslinks in the
structure viewer. If defined, the values must be set True
(case-insensitive), if the restraint is satisfied, and
False (case-insensitive) otherwise. Other values
will cause an error.
If the column is not defined, all crosslinks are displayed
in the style for satisfied restraints (blue).
Pseudobonds
Alternatively, there is limited support for
.pb files containing
pseudobonds (as, for example, used by ChimeraX),
which consist of pairs of atom specifiers.
Example:
/b:1@ca /c:5@cb
However, user-defined labels are not supported, and the chain names as specified in the corresponding structure file must be used. Additionally, the residues must be specified using 1-based indices, and atom names are not validated (invalid atom names might lead to the structure viewer displaying the associated crosslinks incorrectly). Models, comments and colors are ignored. The validation feedback is optimized for CSV input, so error messages might be inaccurate.